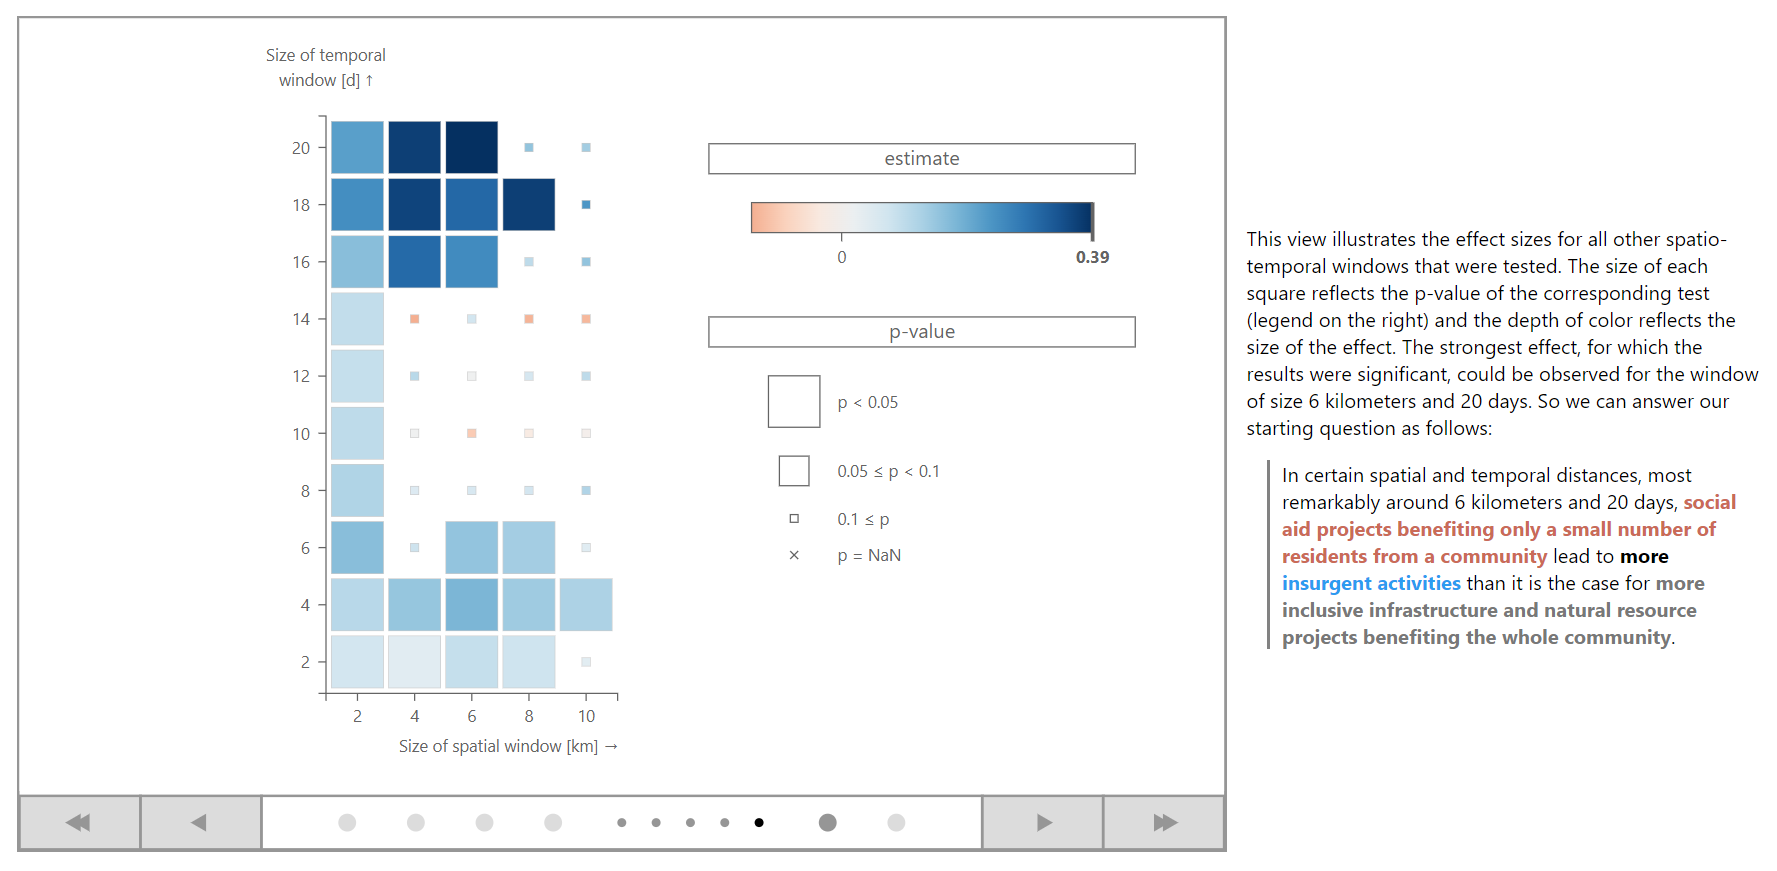
To explain the workings of a conflict research method to scientists from the field, we developed an interactive visual data story.
In the story, we introduce the different mechanics of the method step-by-step. Each view transitions directly into the next to facilitate consistency and comprehension. At the end of each section corresponding to one mechanic, the user has the option to interact with a visualization to deepen their understanding of the conveyed information.
For creating the story, I had to dig deep into the related research papers to understand the method to a degree that I can explain it to other conflict researchers. I also collaborated closely with one of the developers of the method.
We tested the story with several conflict researchers who found it to be an engaging and effective way of explaining such information.
Publication: B. Mayer, K. Donnay, K. Lawonn, B. Preim, and M. Meuschke. “Expert exploranation for communicating scientific methods - A case study in conflict research.” In: Computers & Graphics (2024).
| TYPE | Visual data story |
| TECH | JavaScript, React.js, D3.js, R |
| ROLES | Conceptualization, Design, Implementation |
| YEAR | 2024 |
| PARTNERS | Otto von Guericke University Magdeburg, University of Zurich |
