Explanations of the solutions I offer
- Dashboards for exploring data sets to find insights.
- Analytical reports to summarize insights from an analysis.
- Data stories to communicate insights in an engaging way.
To do so, I use an accessible hypothetical example scenario:
Scenario
Bianca, the owner of a pizza restaurant, has collected the pizza sales data of the past year [1] and she wants to work with the resulting data set.1. Dashboard
In the first case of the scenario, Bianca wants to explore the sales data to answer the following questions:
- Which pizzas are sold the most and which generate the highest revenue?
- When are the most/the least pizzas sold?
- Which ingredients are used how often?
Bianca would also like to be able to focus on specific pizzas and time periods to explore the data in more detail.
To help Bianca reach her goals, I have created the following dashboard (intended for desktop usage):
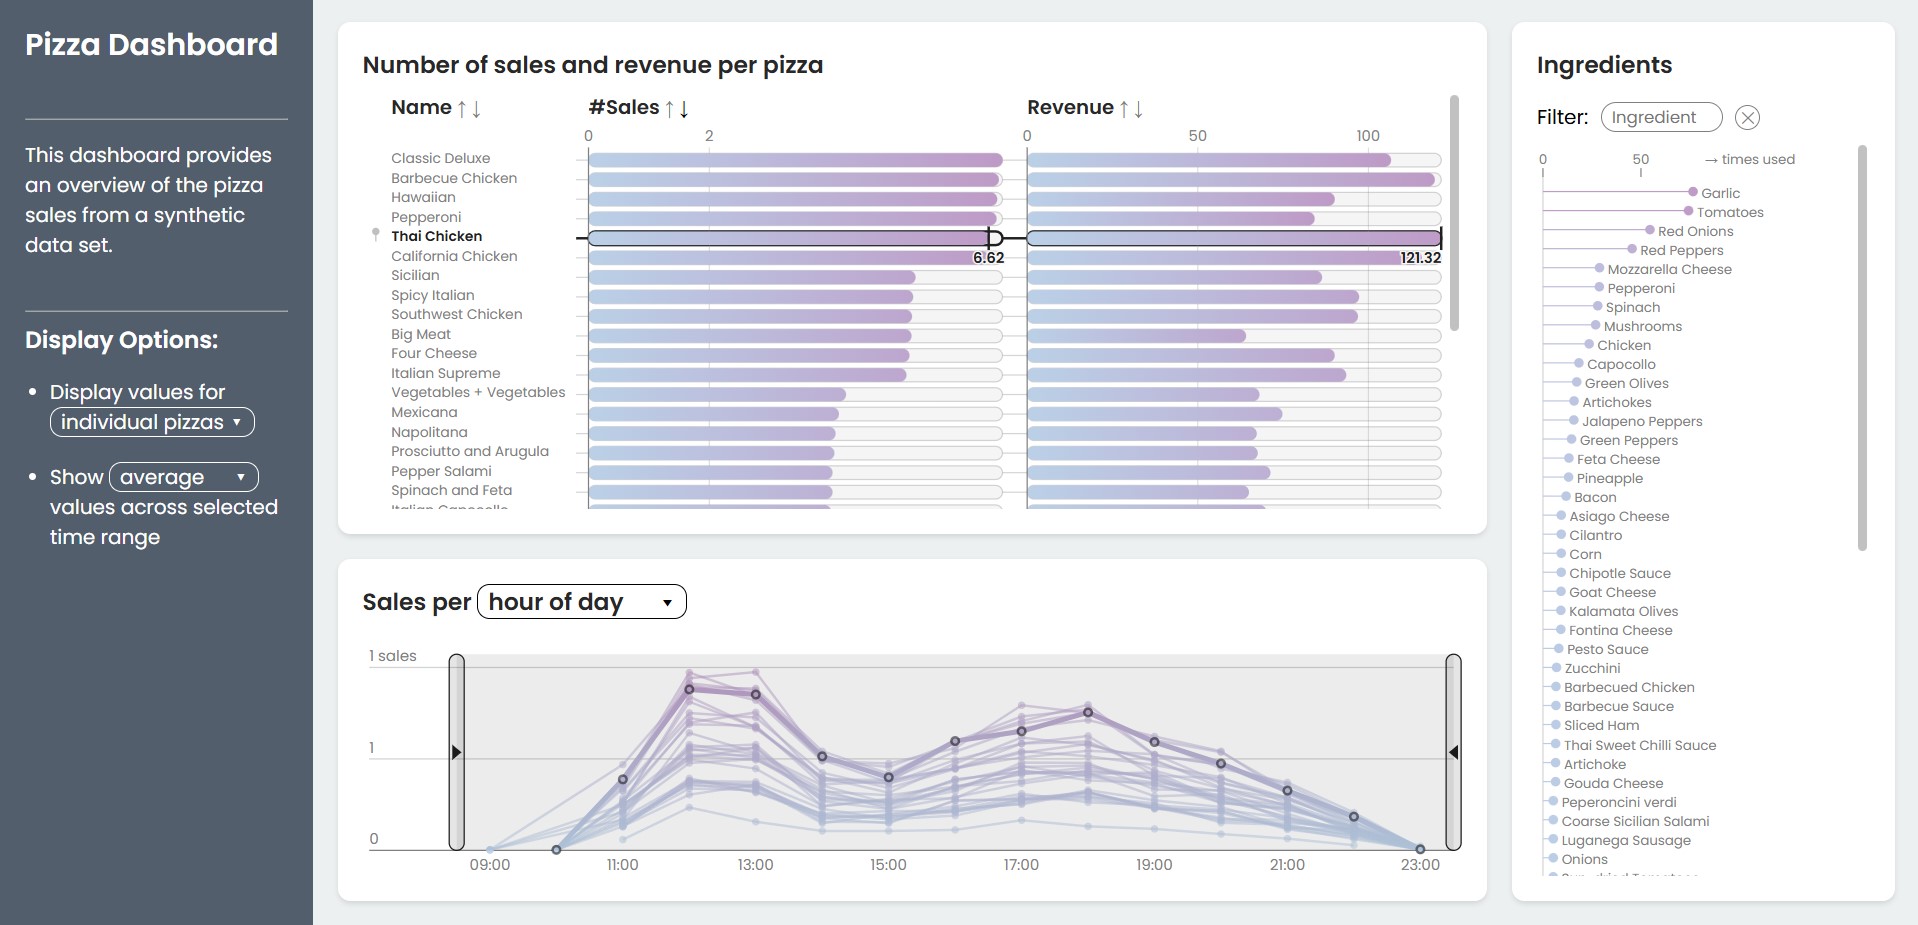
The dashboard relies on interaction to adjust various parameters and filters to explore the data. You may refer to this YouTube video for an explanation of the different interaction techniques.
2. Analytical report
In the second case of the scenario, Bianca has a list of questions that she would like to get answers for based on the data. She does not want to explore the data herself, but she rather wants a summary of the insights backed up by charts. She has the following questions:
- Which pizzas are sold the most/the least?
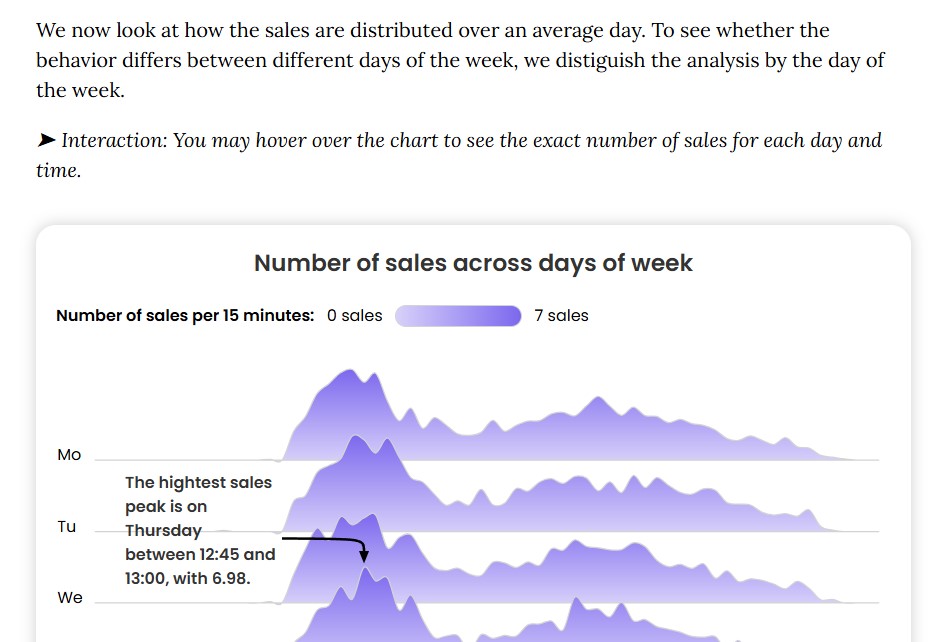
- How are the sales distributed over the course of an average week/an average day?
- Which ingredients are used the most?
- How can the business be improved?
To help Bianca reach her goals, I have created the following analytical report:
Bianca can use the report to make informed decisions about her business. She can also use it to explain decisions to her employees, like the restaurant manager.
3. Visual data story
In the third case of the scenario, Bianca wants to engage potential customers, informing them about the pizzas offered in her restaurant and allowing users to playfully explore the pizzas by price and popularity.
To help Bianca reach her goals, I have created the following data story:
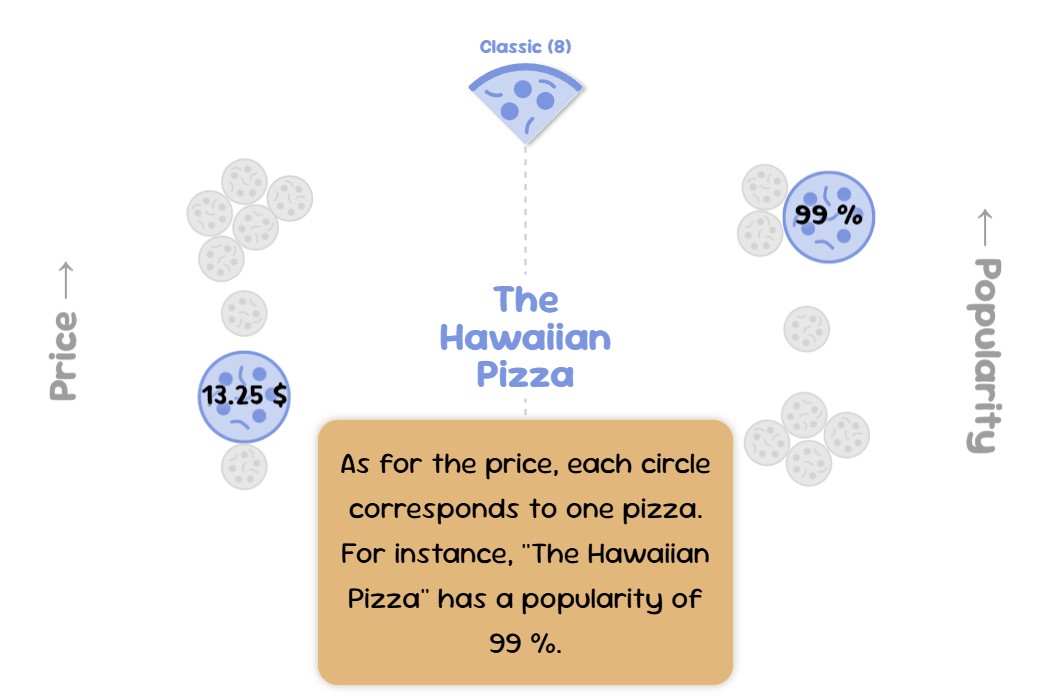
Potential customers can scroll through the story and interact with the visualizations at dedicated points.
[1] The data set is taken from kaggle and slightly adjusted for the demos.