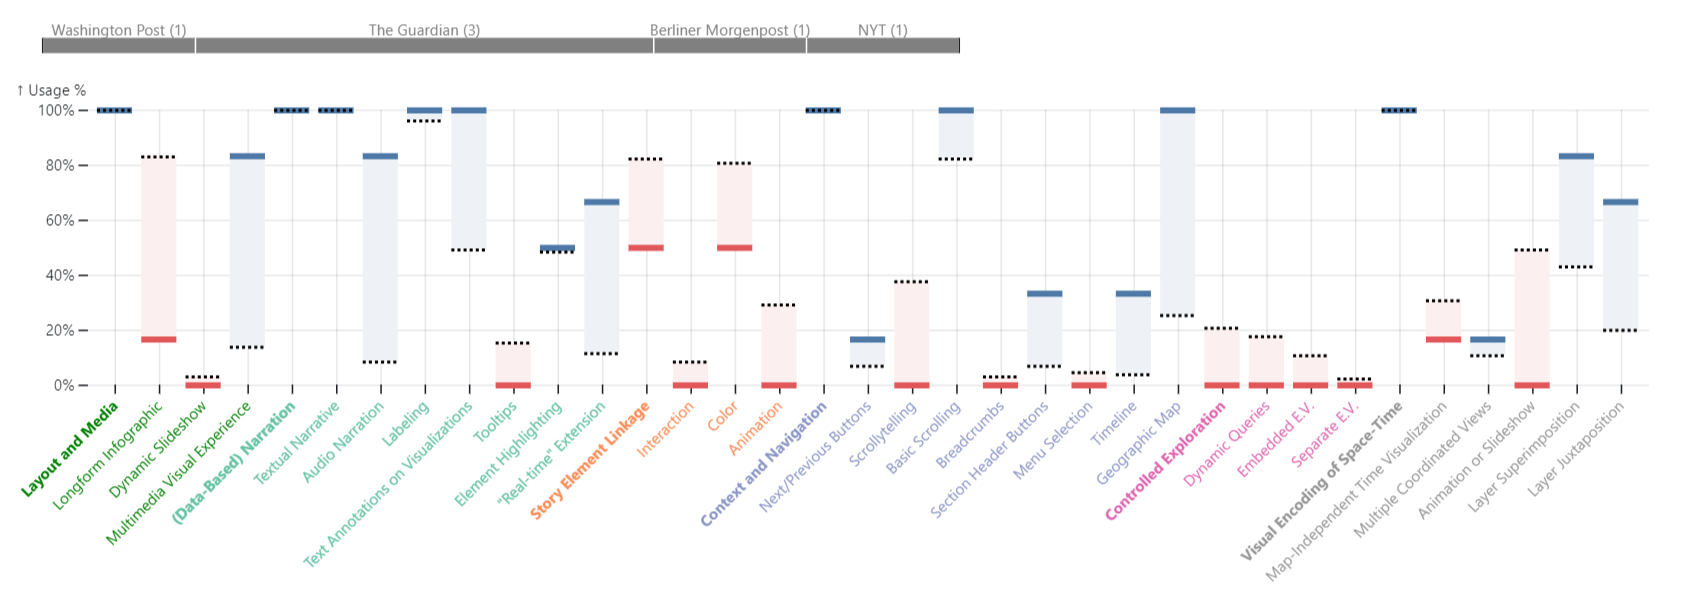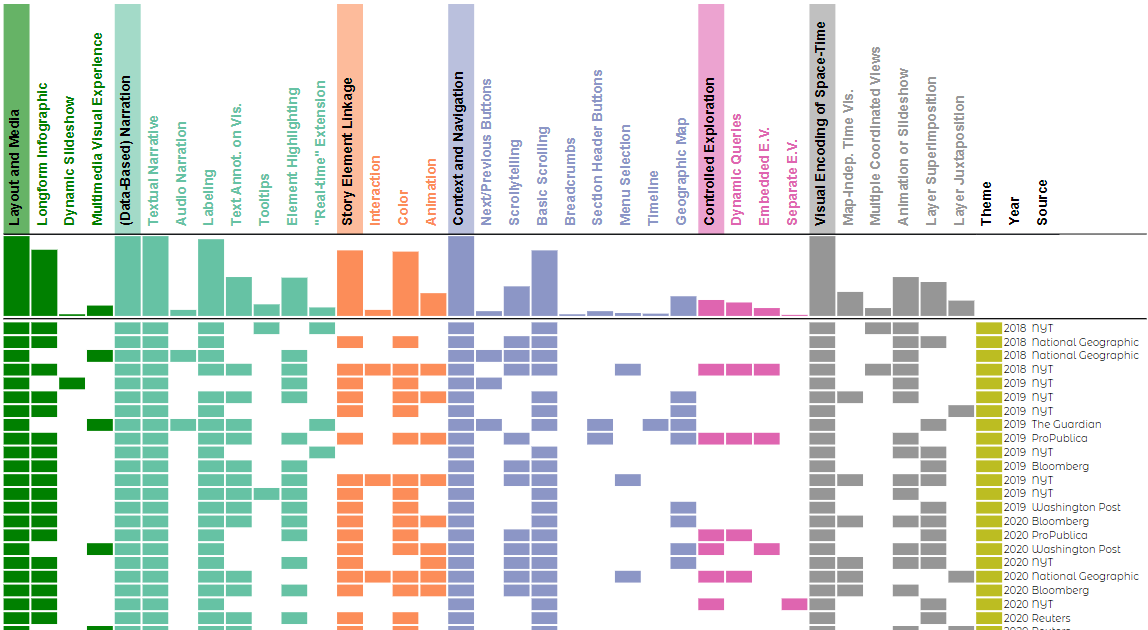
To better understand how visual data stories are commonly written, we collected 130 online stories to analyze what kind of storytelling techniques they use.
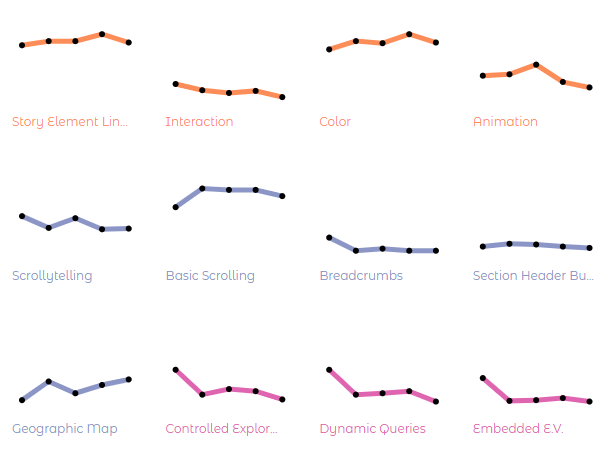
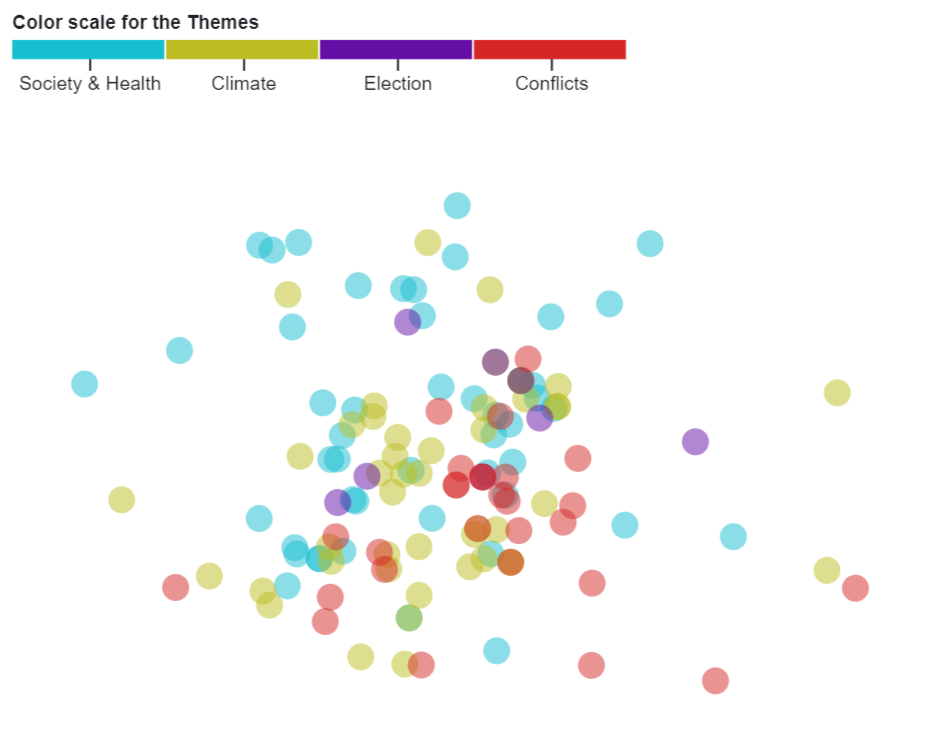
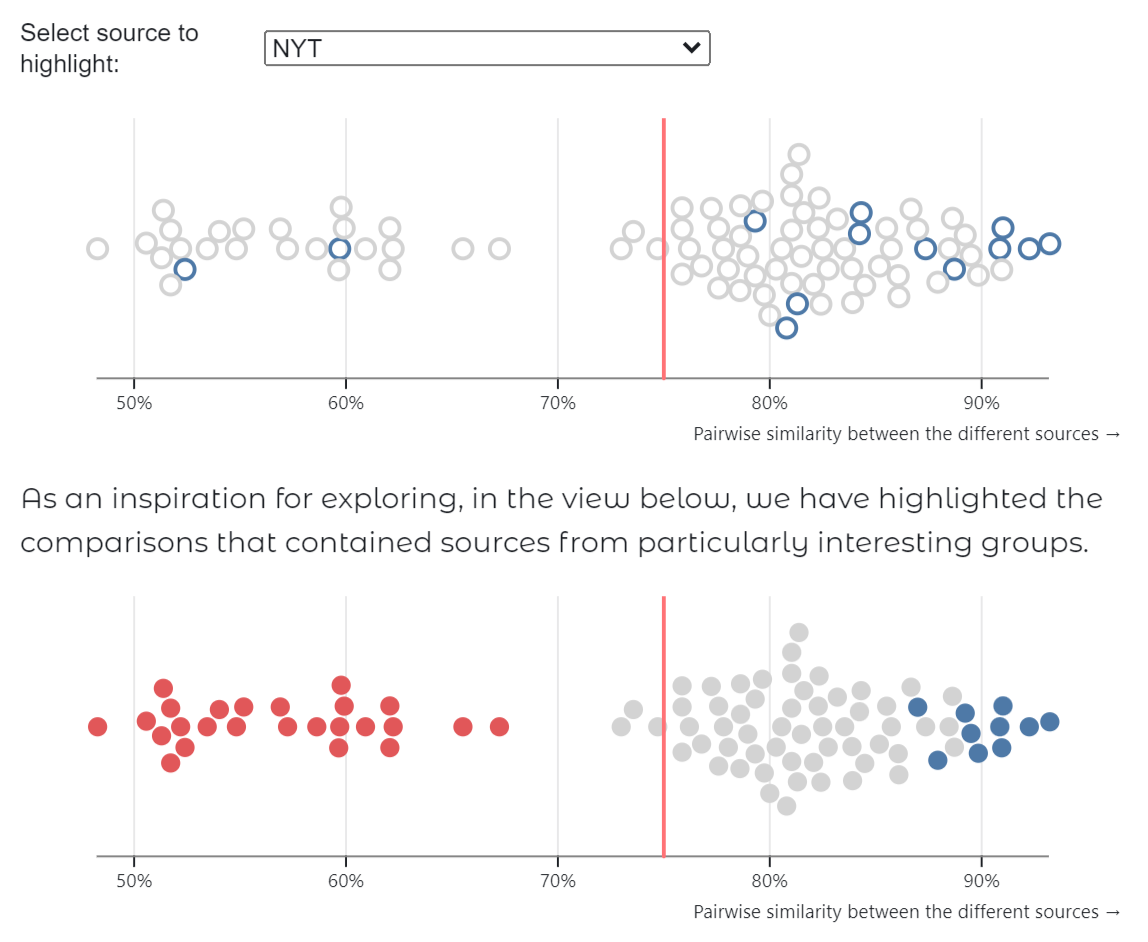
We focused on stories with a spatio-temporal context, as systematic analyses of them were still quite sparse. To classify the stories based on the storytelling techniques they use, we merged and adapted three existing design spaces. We analyzed the results of the classification by exploring overall distributions, comparing subsets, identifying trends, and using advanced techniques like multidimensional scaling.
We summarized the results in an interactive report which facilitates an easy combination of visualizations and textual explanations, while providing the option to inspect the underlying code for full transparency.
Publication: B. Mayer, N. Steinhauer, B. Preim, and M. Meuschke. “A Characterization of Interactive Visual Data Stories With a Spatio-Temporal Context.” In: Computer Graphics Forum 42.6 (2023), e14922. doi: 10.1111/cgf.14922.
| Type | Analytical report |
| Tech | JavaScript, D3.js, Observable Notebooks |
| Roles | Conceptualization, Design, Implementation |
| Year | 2023 |
| Partners | Otto von Guericke University Magdeburg |