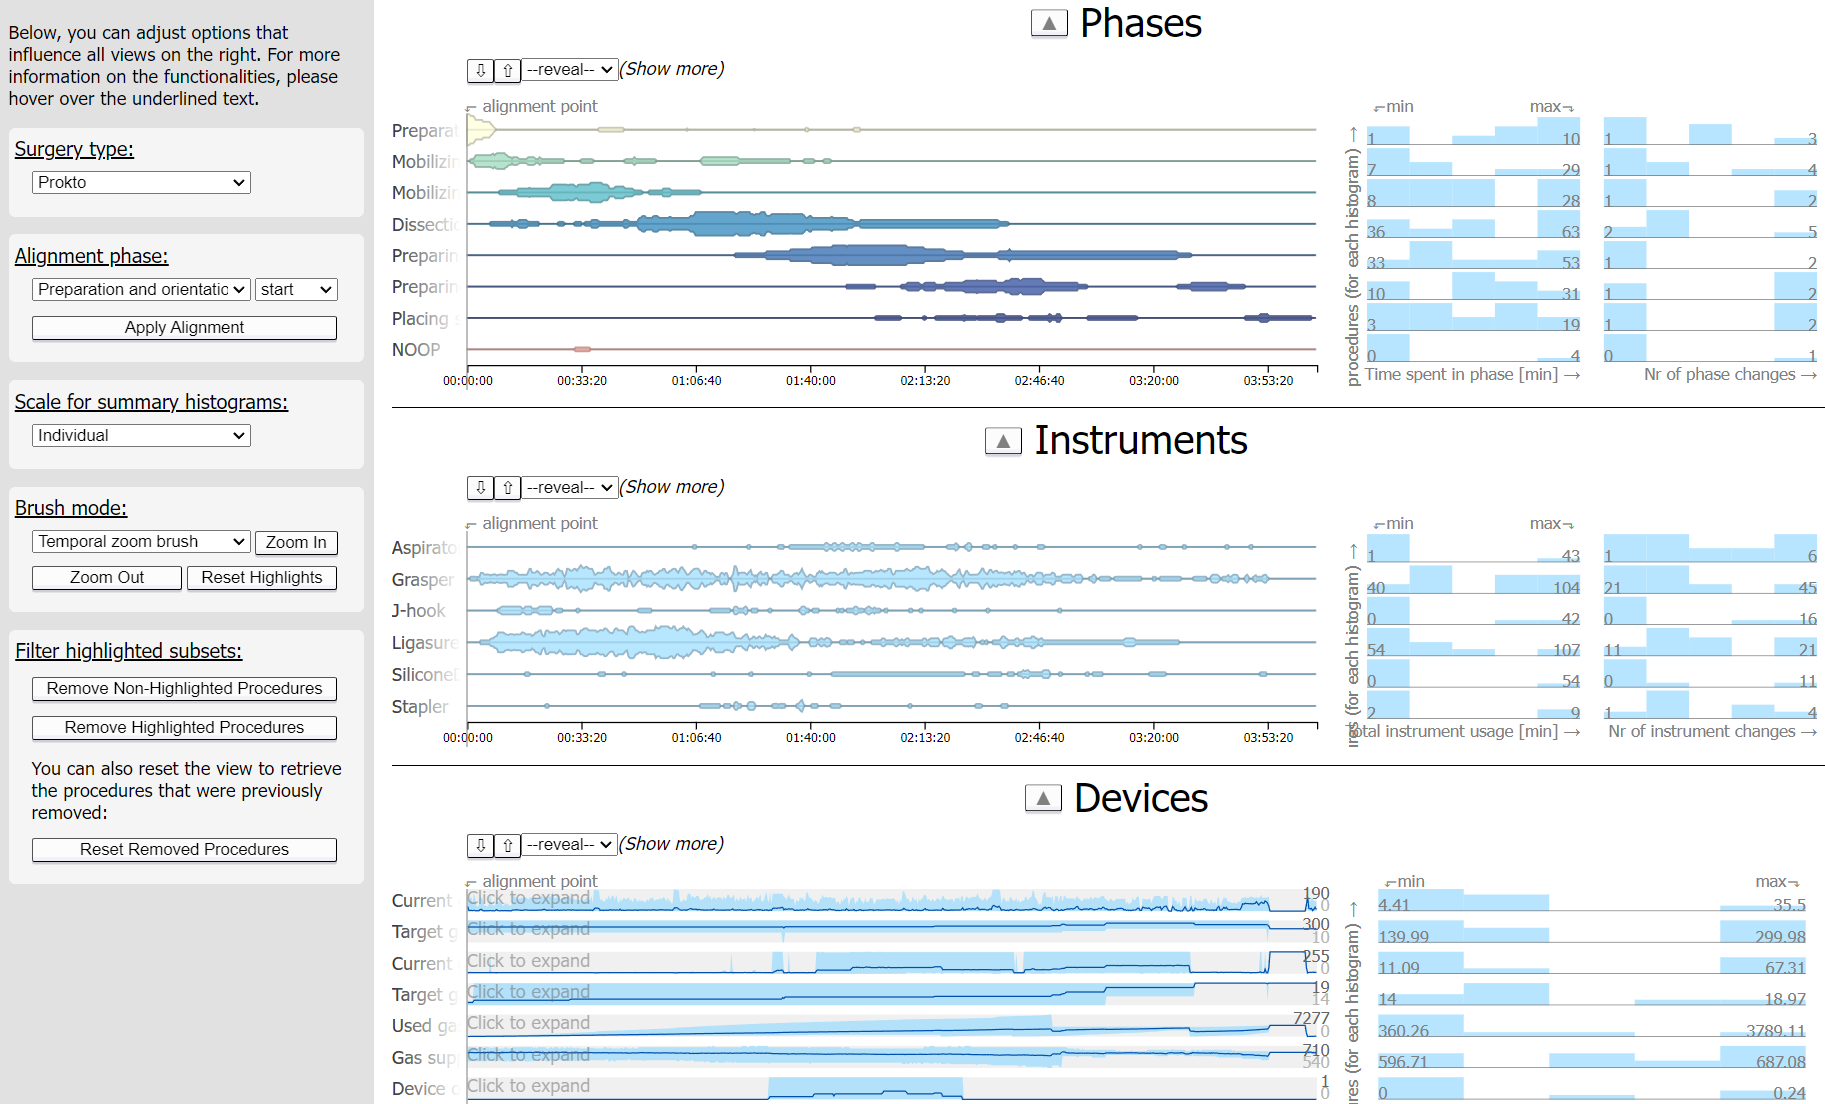
Integrated operating rooms provide rich and heterogeneous data about surgical procedures. This includes information about the different phases of a procedure, the instruments used, and the measurements of different devices. Such information is commonly time-dependent and complex to analyze in unison.
To allow such comprehensive analysis, we created a dashboard to inspect and filter the information side-by-side. Together with medical experts, we discussed which views of the data are relevant for them and which interactions they require for analyzing the data more deeply. As they were not always aware of the different options that exist for doing so, we tried to get a deeper understanding of the goals they had for the data, based on which we provided them with a selection of suitable options to choose from.
This prototyping-based iterative procedure led to a solution which allowed the experts to get a much more comprehensive understanding of the heterogeneous data.
Publication: B. Mayer, M. Meuschke, J. Chen, B. P. Müller-Stich, M. Wagner, B. Preim, and S. Engelhardt. “Interactive visual exploration of surgical process data.” In: International Journal of Computer Assisted Radiology and Surgery 18.1 (2023), pp. 127–137. doi: 10.1007/s11548-022-02758-1.
| Type | Analytical report |
| Tech | JavaScript, D3.js |
| Roles | Conceptualization, Design, Implementation |
| Year | 2021 |
| Partners | Otto von Guericke University Magdeburg |