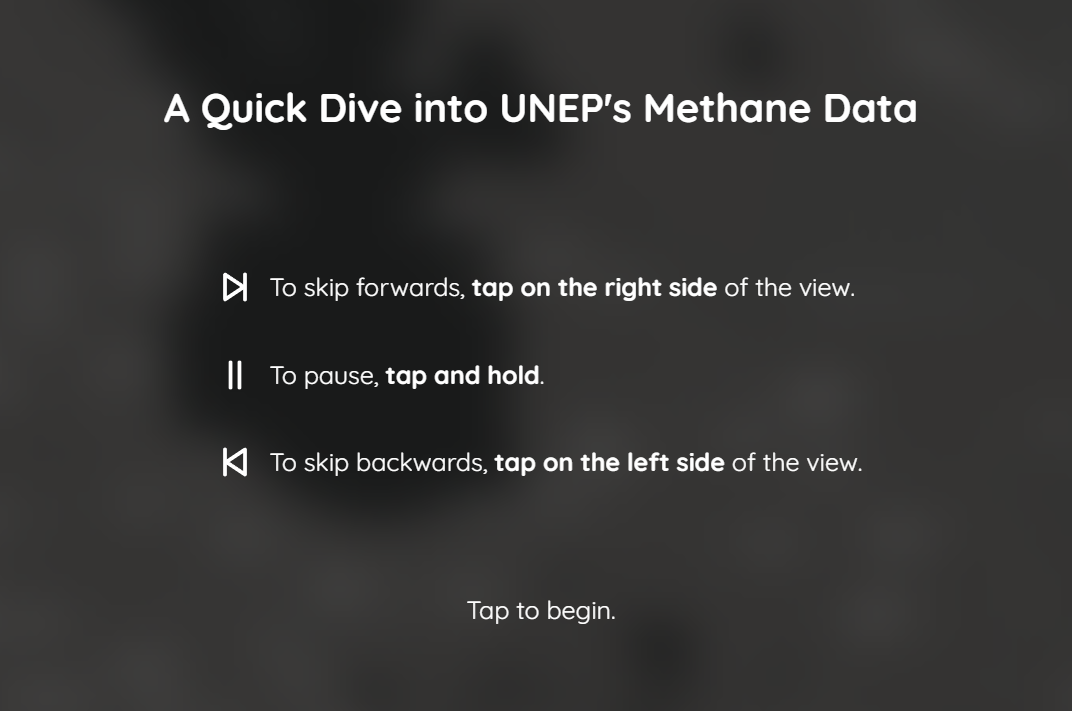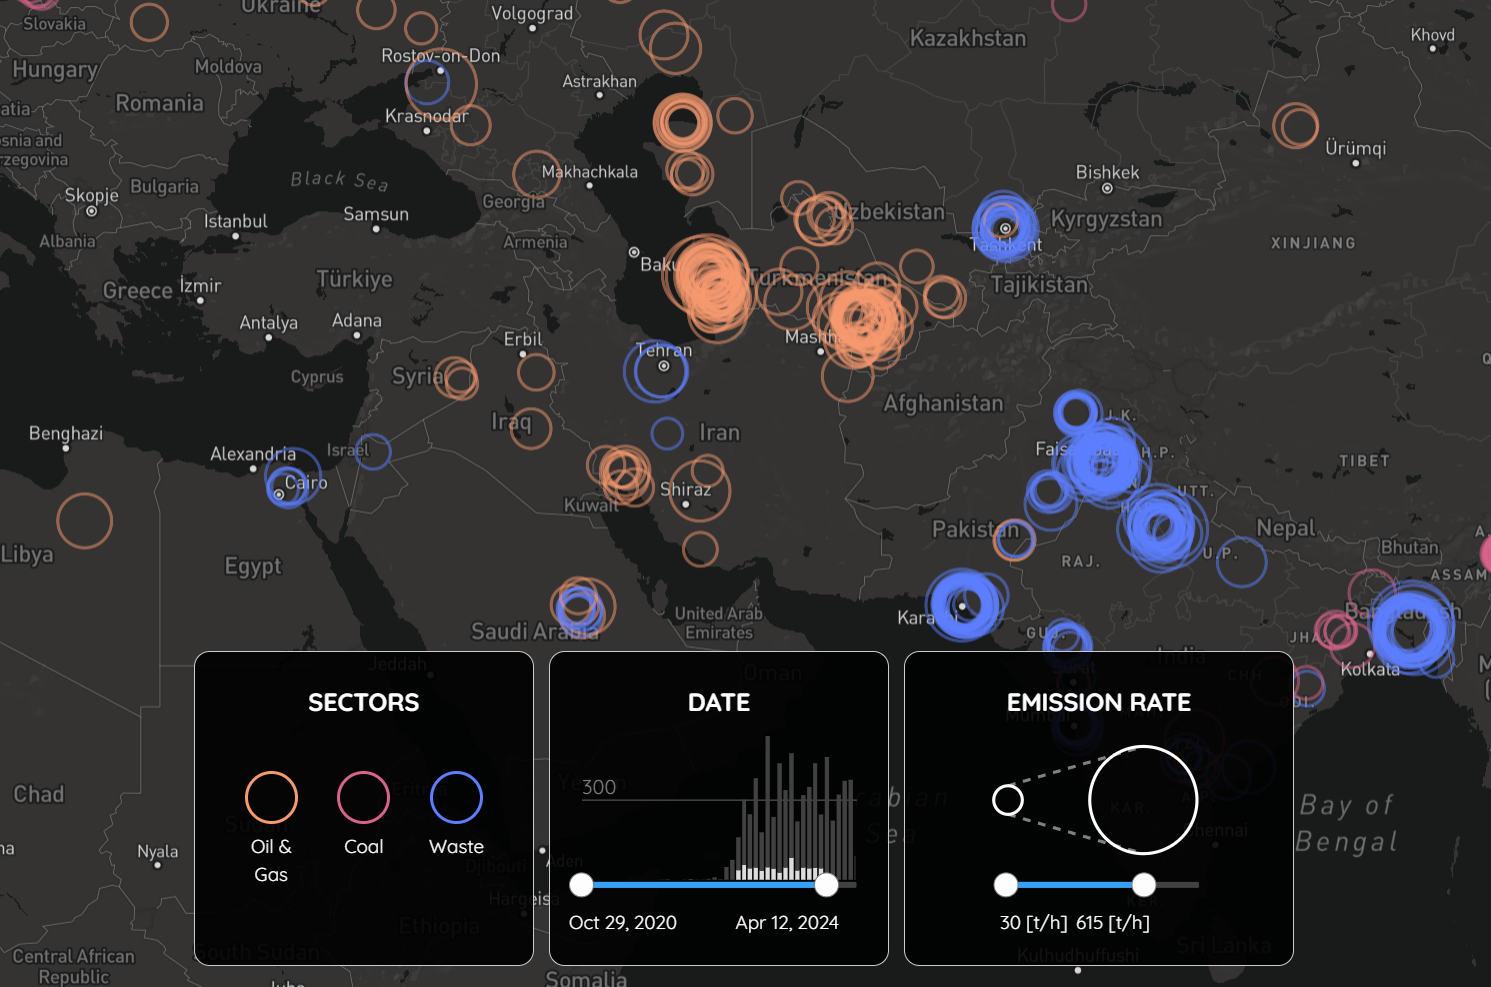
During my freelance work for Data&Design, Rudi O'Reilly Meehan and I developed a visual data story to introduce a data set reporting on methane emissions by the International Methane Emissions Observatory. The story adapts the navigation popularized by video-based social media stories. Tapping the left or right side of the screen allows to navigate forwards or backwards, and pressing and holding the screen pauses the playback.
The story itself, however, is not a video, but consists of animated HTML elements. This allows the viewer to interact directly with the underlying data to explore it at the end of the story.
| Type | Visual data story |
| Tech | Svelte, GSAP, D3.js |
| Roles | Conceptualization, Design, Implementation |
| Year | 2024 |
| Partners | Data&Design |